Challenge Clock:
visualizing progress of challenges
- Categories: Design, Visualization
- Year: 2013
- Demo: Challenge Clock
-
Keywords:data visualization, d3.js, interaction design
Background
The outcome of a hackathon at Stanford organized by the Brown Institute.
Function & Implementation
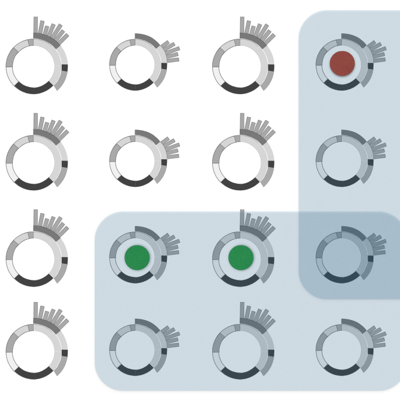
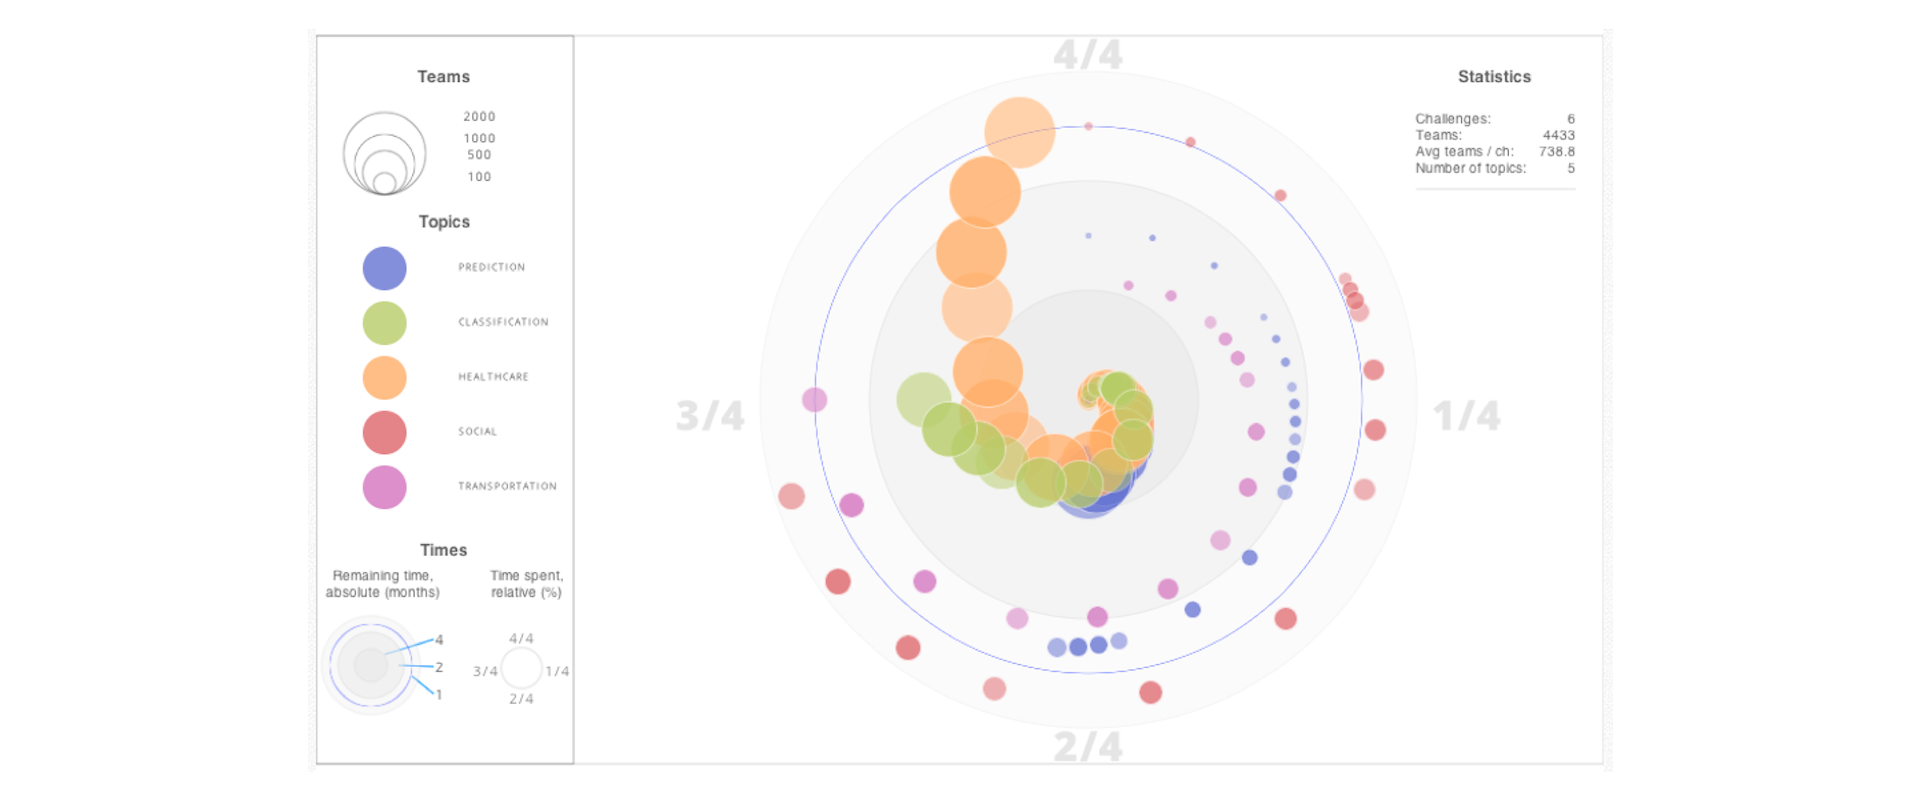
The clock displays challenges (data pulled from Kaggle) and their temporal progress with the
number of teams participating to each competition (the size of the circles).
The remaining and already spent times are shown in absolute and relative terms:
the remaining time in months (absolute measure, months inversely proportional to the radius) and the time spent (relative, the angle measured from 12 o’clock).
The visualization is interactive, shows the end state with the prizes won. Try out the demo (see link on the left, or click on the image above).