Spoken Dialogue Visualization
- Categories: Interaction, Visualization, Publication
- Year: 2000
-
Keywords:evaluation, analysis, speech, spoken dialogue system, corporate dialer, visualization
Background
The driving force behind visualizing spoken interactions was the need to prove that the overall task success rate of a spoken dialogue implementation was significantly higher than the component level speech recognition accuracy. The visualization clearly showed that the interaction manager took care of correcting mistakes, and consequently, guided users to complete their tasks, although speech recognition errors occurred.
Implementation
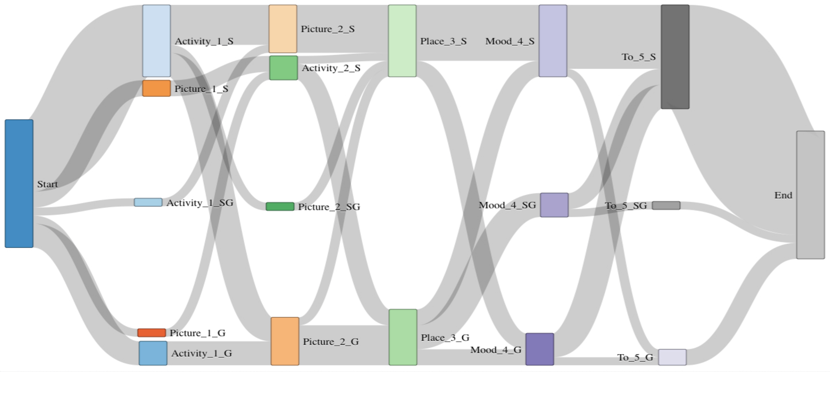
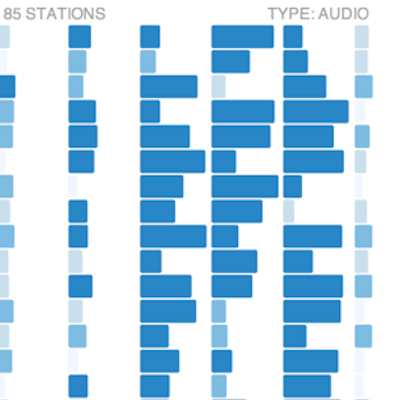
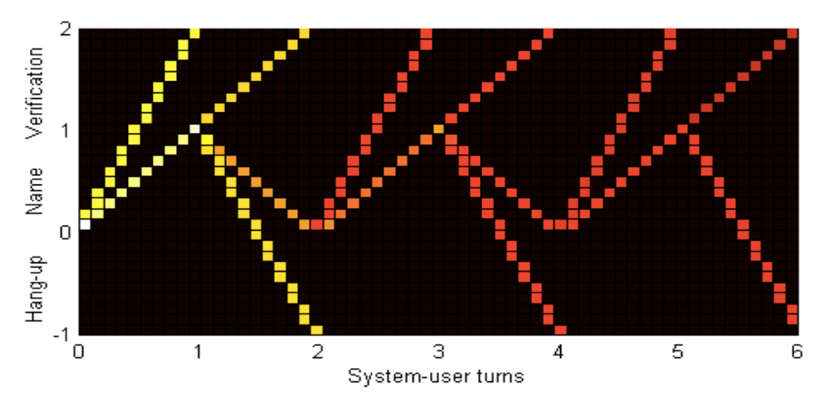
The above figure shows a visualization of interaction paths for nearly 4,000 calls with a speech-enabled corporate dialer application.
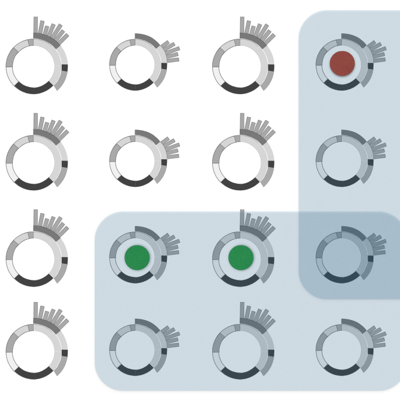
The visualization shows with lighter coloring how successful dialogues are achieved in one or two steps, as well as the more problematic
ones that took longer steps, depicted with reddish color.
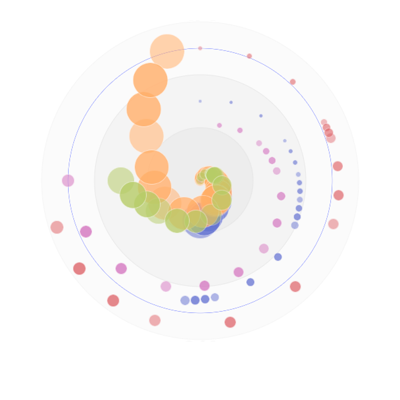
Also, a combined metric was introduced (combining the quantitative and qualitative aspects of evaluation)
that weighted shorter dialogue paths with higher weights, versus the longer ones that ended in failure.
Publication
This work was published in a paper and presented at ICSLP'2000 in Beijing, China.