SeaBird: Acoustic Data Visualization
- Categories: Design, Visualization
- Year: 2013
- Client: Nexleaf Analytics
-
Keywords:data visualization, d3.js, interaction design
Motivation
This project for a non-profit organization was about environmental sensing.
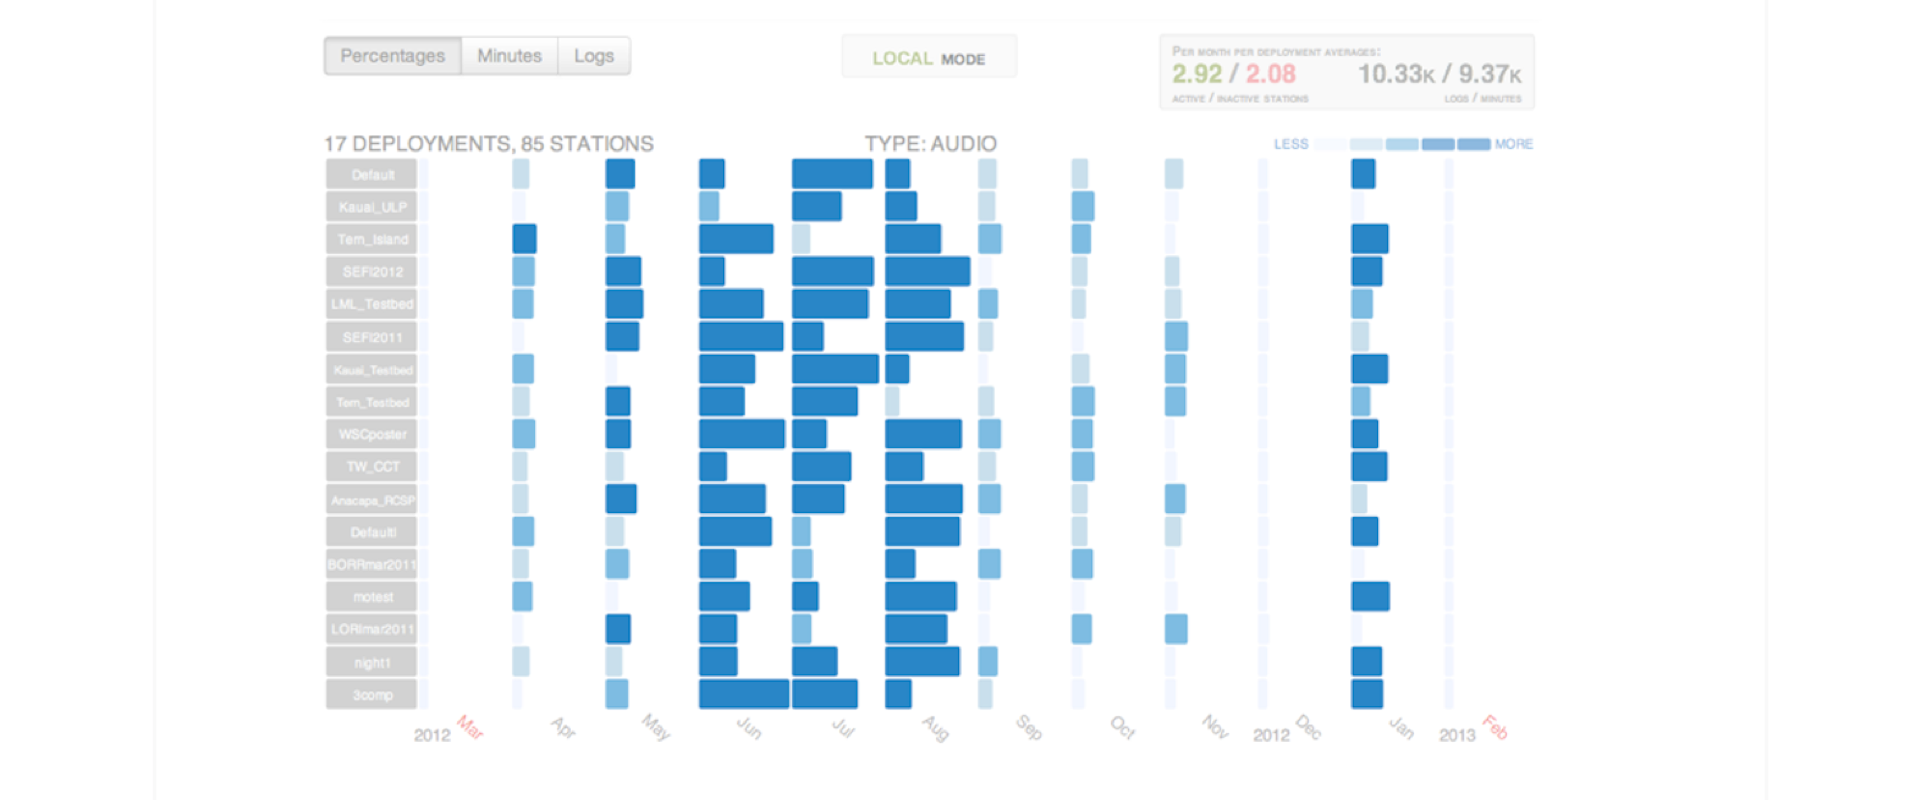
The goal was to visualize data, acoustic recordings, coming in from remote sensing stations on the California coast and on Hawaii.
The project was originally started in cooperation with the other co-founder of zoom::moon, then finalized alone the majority of functionalities.
Functionalities
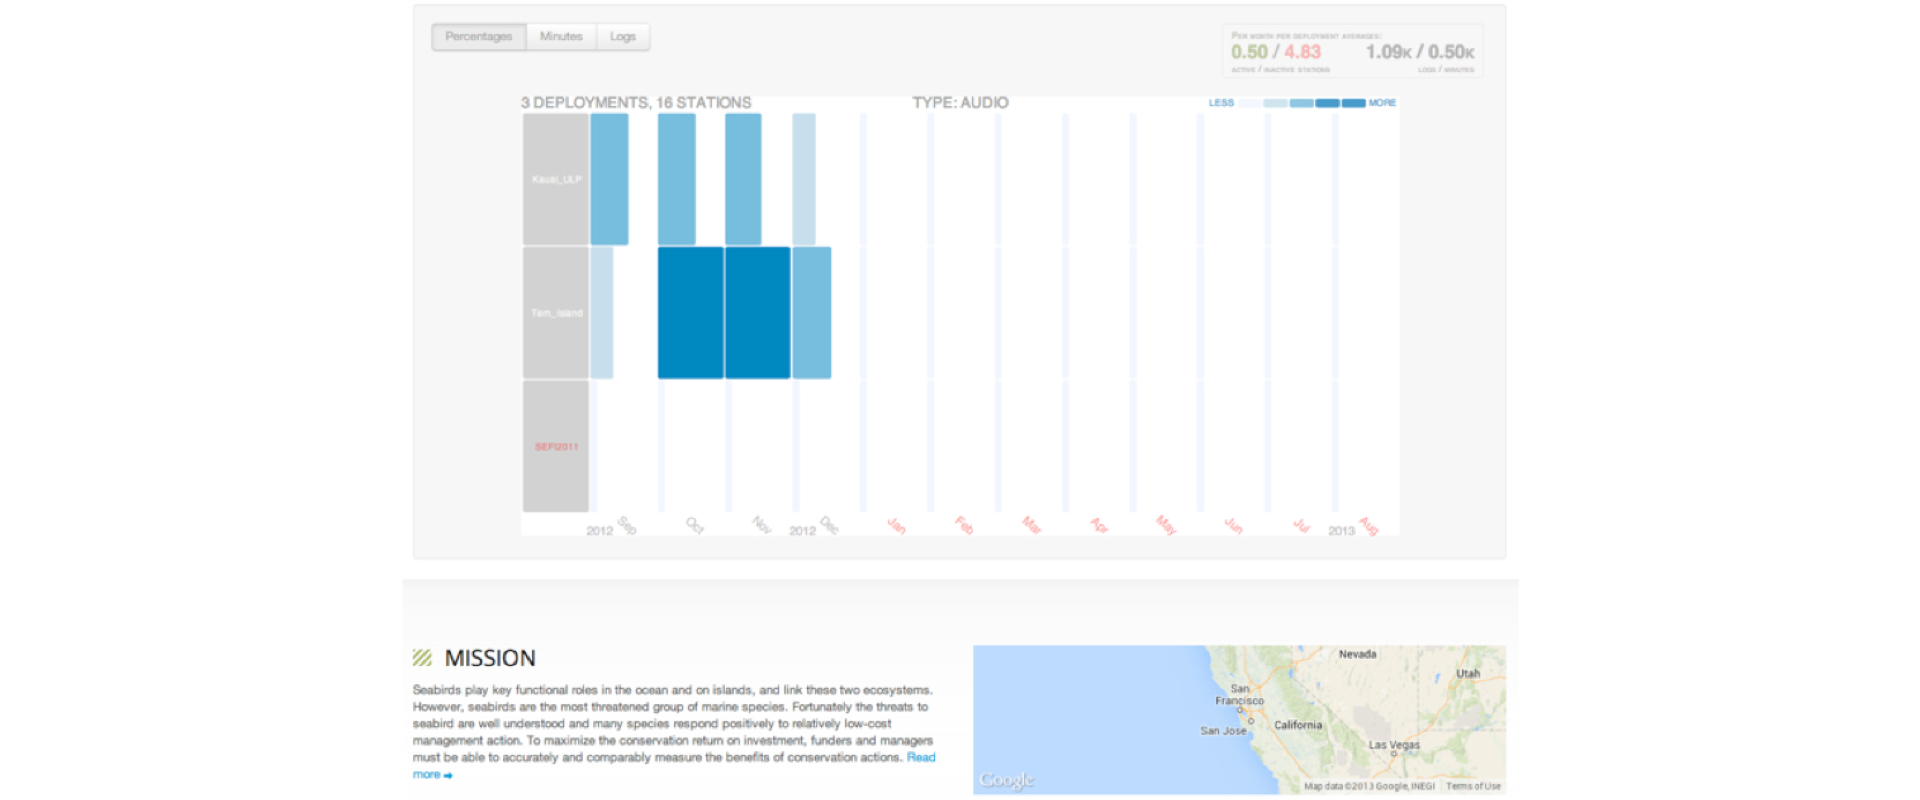
- - annual overview of all recordings from all projects;
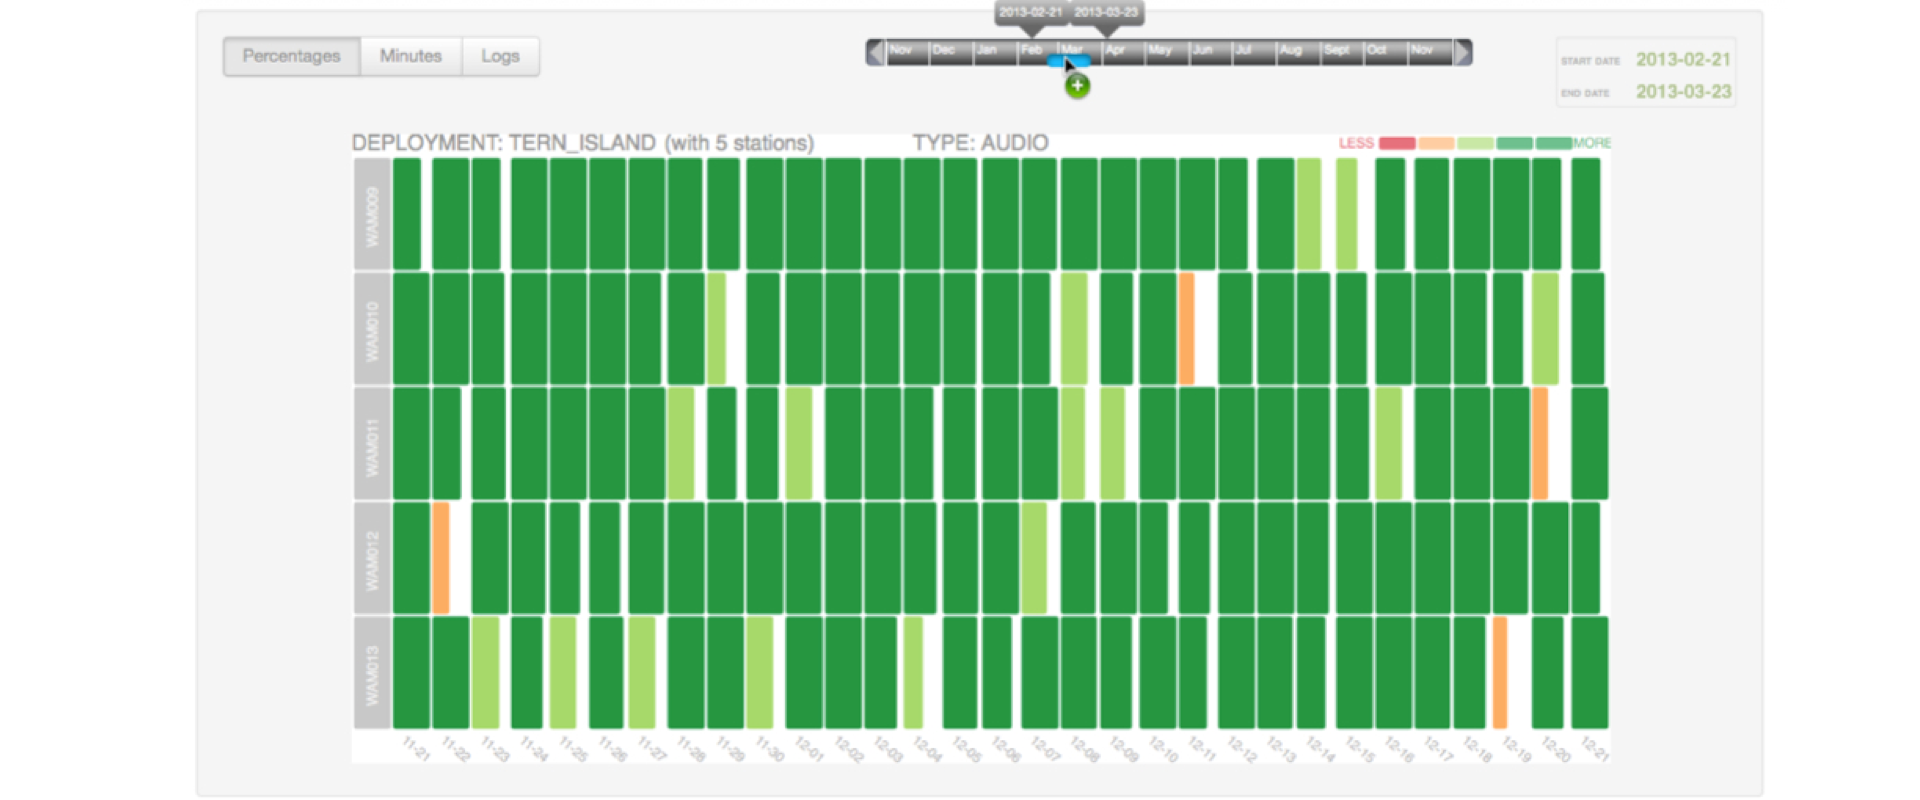
- - drill-down to monthly overview of a selected project with all its sensing stations;
- - date range picker with a slider;
- - statistics for selected date range in terms of amount of recorded data (logs/minutes and active/inactive stations);
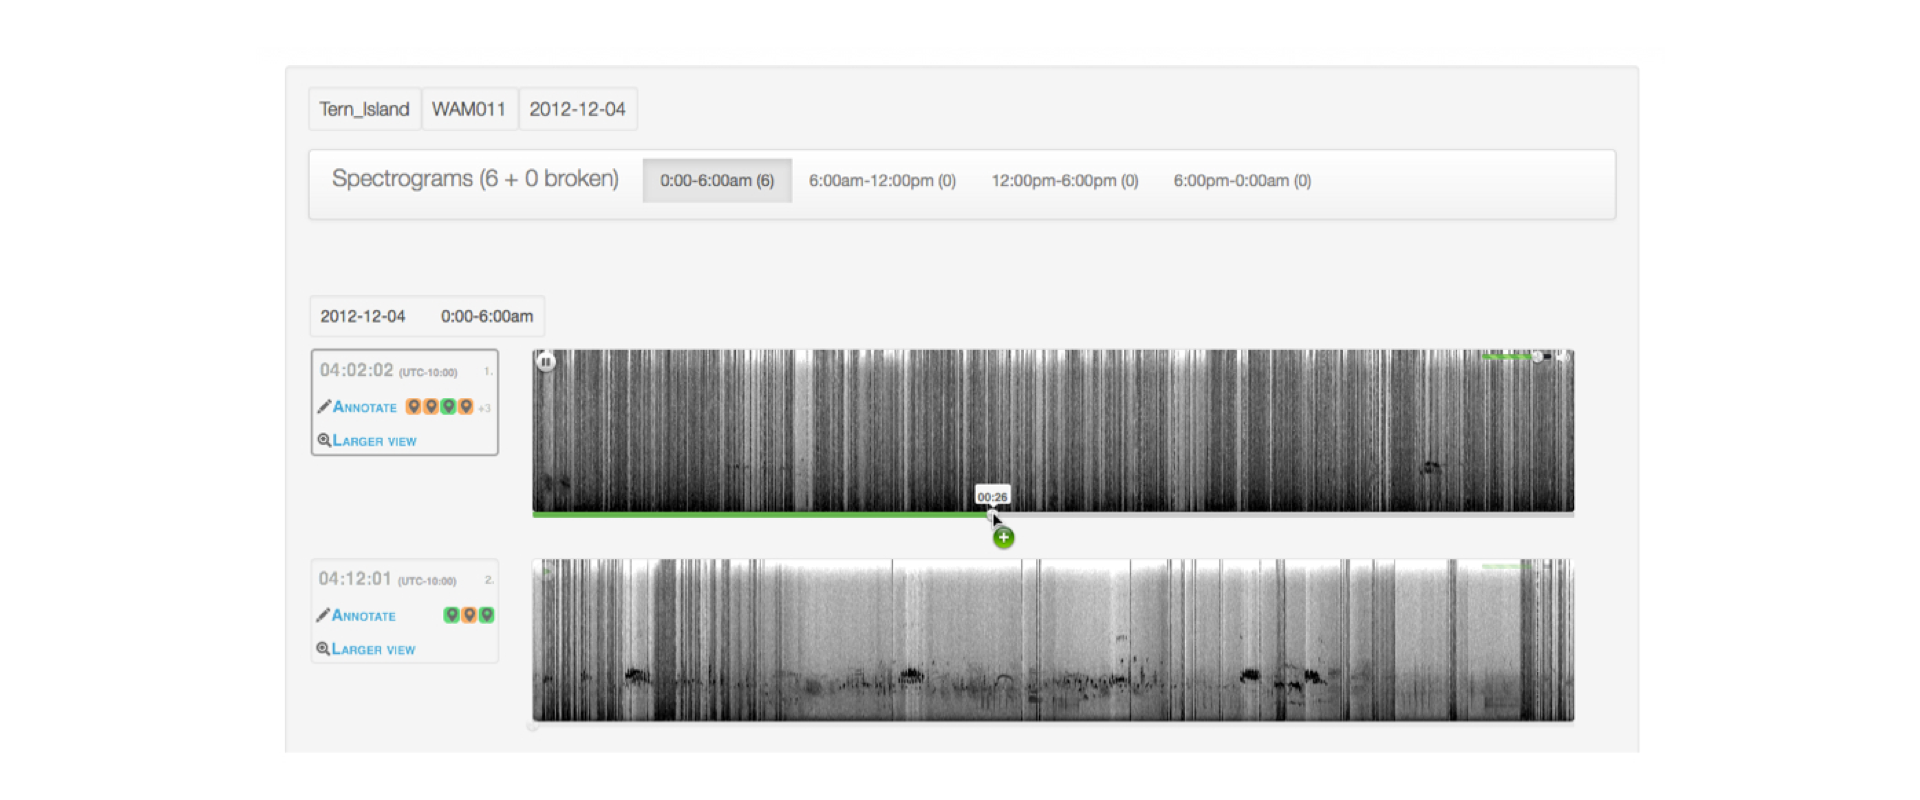
- - presenting recorded data as spectrograms for selected station per selected day;
- - playback functionality (with custom audio player);
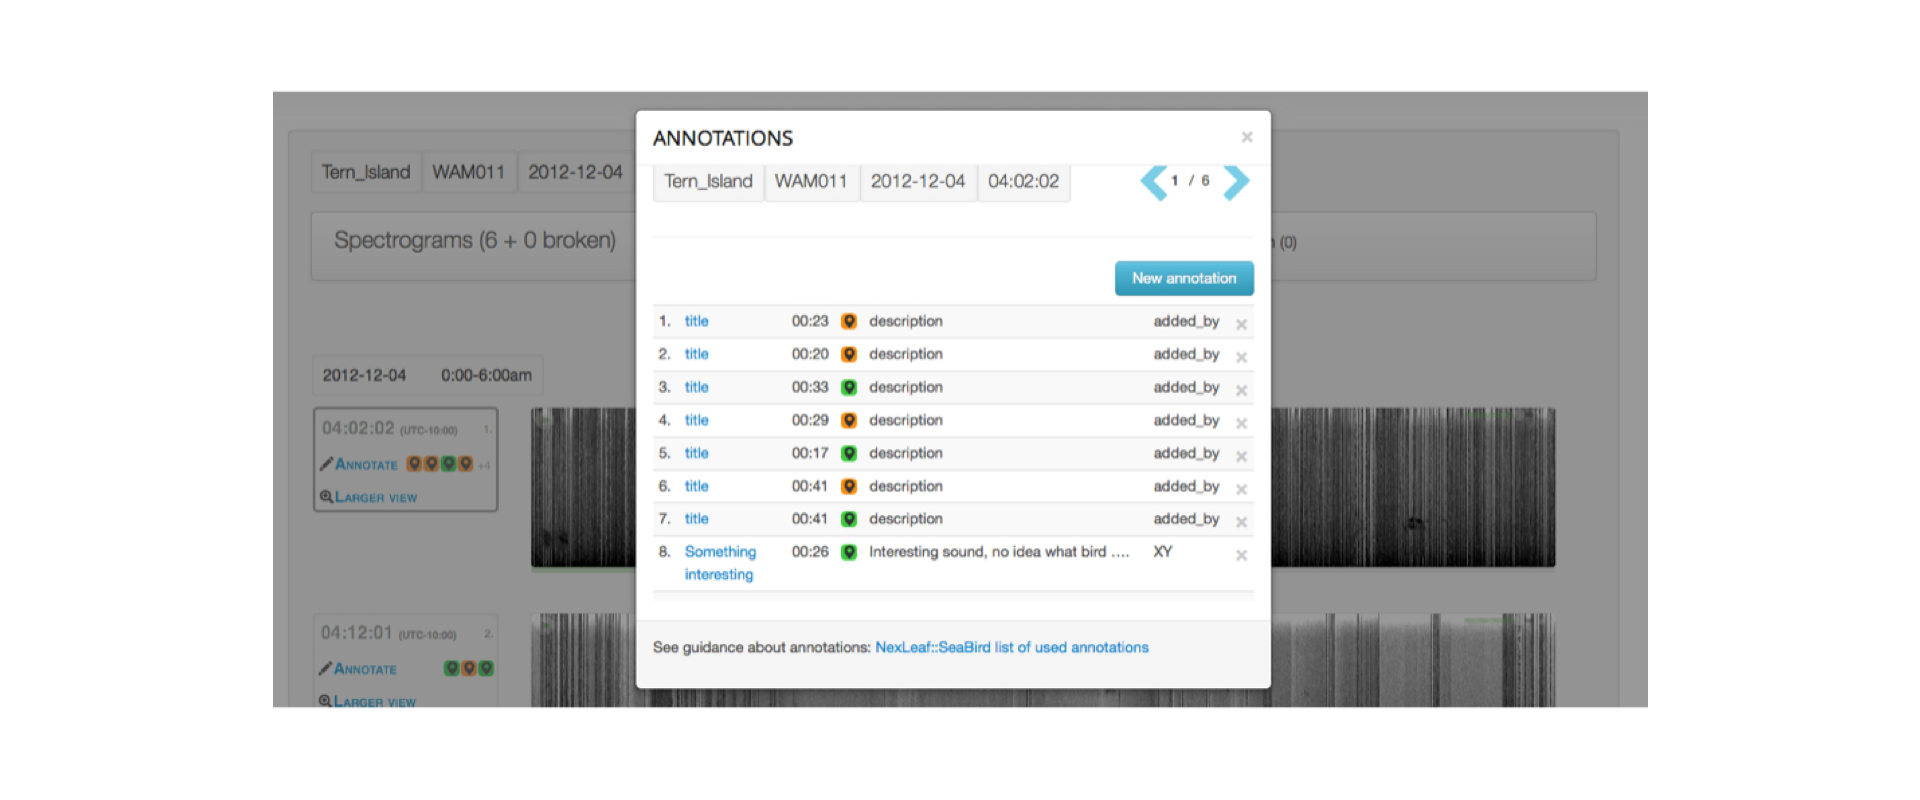
- - manual annotation to any selected recording.