Multimodal Interaction Visualization
- Categories: Interaction, Visualization, Publication
- Year: 2015
-
Keywords:evaluation, analysis, speech, gesture, multimodal interaction, multimodal integration, visualization, d3.js
Motivation
Long worked on evaluation frameworks for interactive systems, and as part of it, how to visualize multimodal interaction. After several attempts, got a solution that found to be useful for iterative design and evaluation of an experience sharing application. Although had some previous experience with visualization of spoken dialogues, and also some failed attempts with multimodal interaction visualization, yet, it took quite some time to arrive to an interactive and visually clear solution.
Rationale
Development of multimodal applications is an iterative, complex, and often a rather heuristic process. This is because in multimodal systems the number of interplaying components can be far greater than in an unimodal Spoken Dialogue System. From the developer’s perspective, a multimodal system presents challenges and technical difficulties on many levels. From the designer’s perspective, all components must be fine-tuned to a level that their combined overall performance can deliver the desired experience to the users.
Implementation
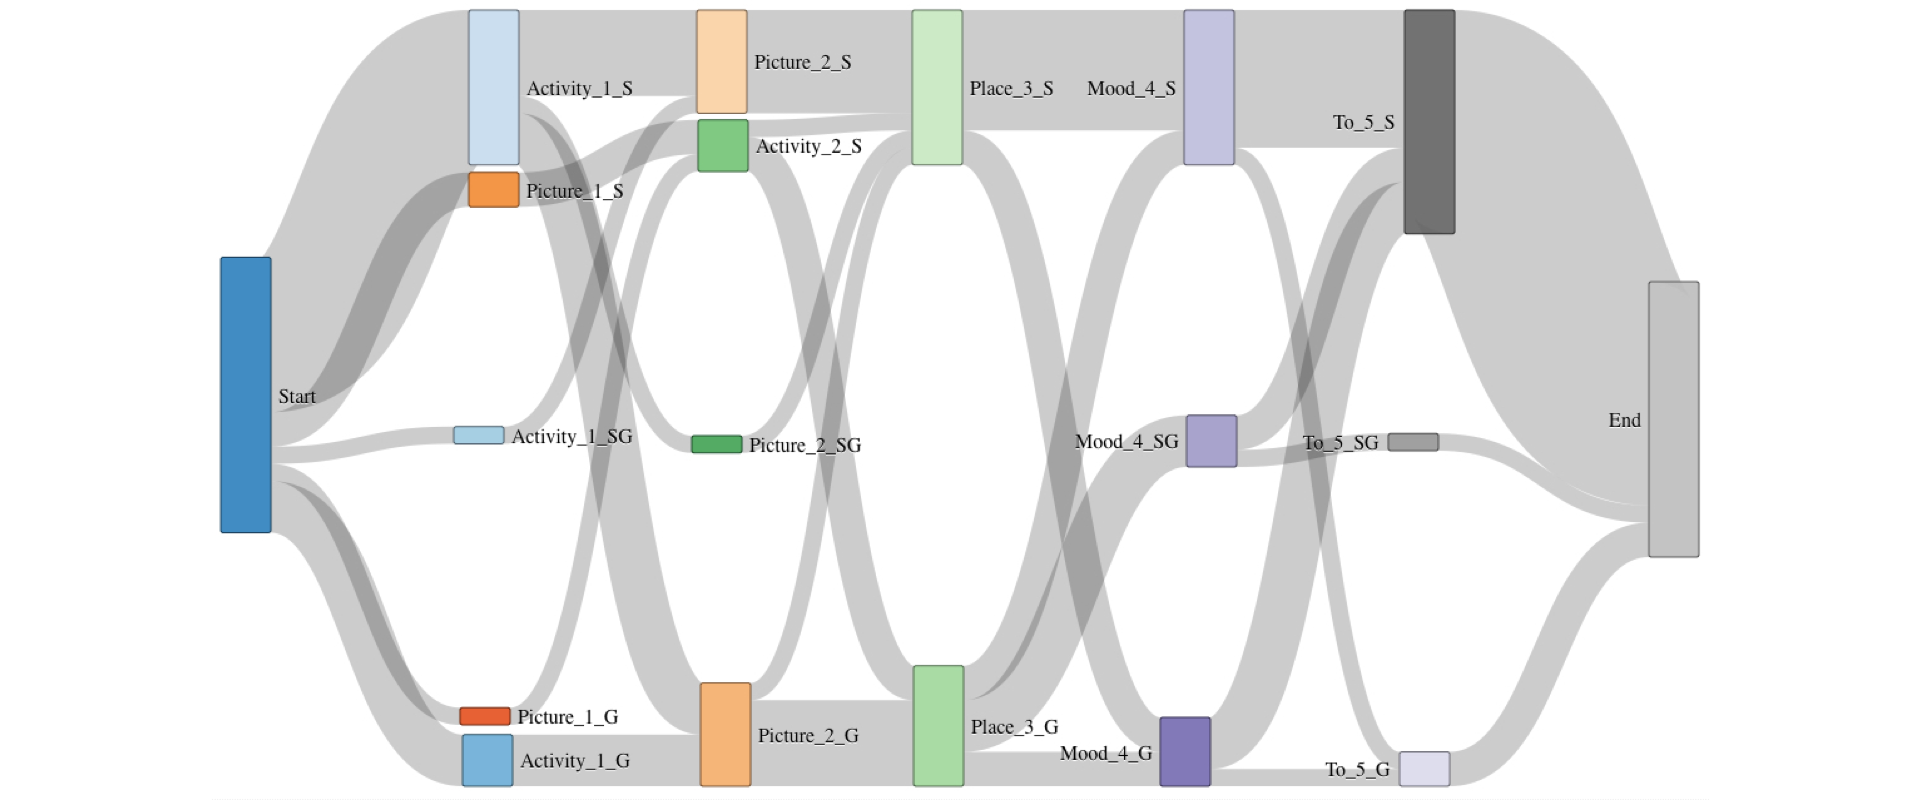
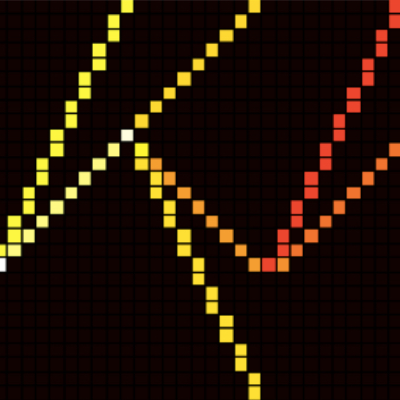
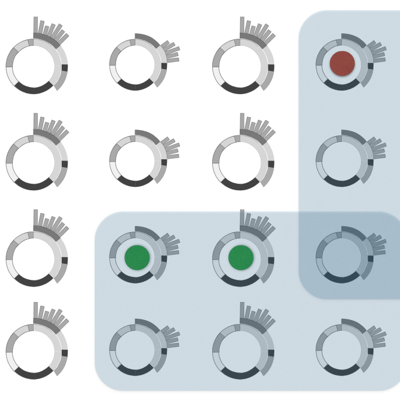
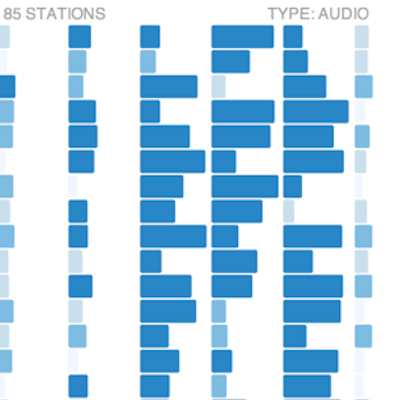
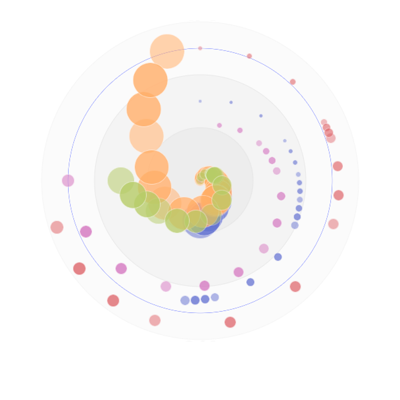
As multimodal interaction represents a complex phenomenon in many different ways, numbers alone do not tell the whole truth. Our assumption was that there is room to look, literally, beyond the numbers to capture the bigger picture,
but also to enable designers and developers to zoom into the details of what is happening within a state, within turn-taking with multiple modalities, and what wording, gestures or other modality-specific inputs are used by users at a
given stage of a dialogue, how the length of a dialogue correlates to the outcome, and so on.
The visualization was implemented using d3.js as an interactive web application.
Publication
A paper was presented on the Turn-Taking and Coordination in Human-Machine Interaction symposium (2015 AAAI Spring Symposia, Stanford University, March 23-25, 2015, Palo Alto, California).
Happy to get feedback, comments and further ideas on how to make this type of visualization more useful and effective.
